Introduction
As industrial IoT infrastructure rapidly scales, businesses face a growing challenge: managing and making sense of the massive volumes of data generated by connected devices, sensors, and edge systems. Without advanced data analytics and data visualization, this flood of information often goes underutilized leading to delayed responses, fragmented decision-making, and missed opportunities.
In this blog, we’ll break down how combining scalable IoT systems with advanced data analytics and AI-powered data visualization unlocks real business value and why it’s essential for enterprises looking to thrive in a connected, data-driven world.
The IoT Data Explosion: A Growing Challenge
What is IOT?
- Data Overload: Too much data without a clear structure or purpose.
- Data Silos: Information scattered across different systems, making it hard to get a unified view.
- Inability to Extract Actionable Insights: Raw data by itself isn’t helpful. What businesses need are insights that can lead to action.
In the following sections, we’ll dive into how leveraging data analytics and data visualization technologies can transform IoT data from a challenge into a powerful business asset.
The Role of Data Analytics in IoT Solutions
Data Collection
Data Analytics for Decision-Making
- Improving Operational Efficiency: By identifying bottlenecks and inefficiencies, businesses can optimize workflows and enhance productivity.
- Predicting Equipment Failures: Through analyzing sensor data patterns, businesses can predict when equipment is likely to fail, enabling timely maintenance and reducing downtime.
- Enhancing Customer Experiences: Analyzing customer behavior and preferences allows businesses to offer personalized services, improving customer satisfaction and targeting offerings more effectively.
Real-Time Processing
- A smart thermostat can automatically adjust room temperature based on current user preferences, optimizing comfort and energy usage.
- Predictive maintenance systems can send alerts to maintenance teams about potential machine failures before they happen, minimizing downtime and avoiding costly repairs.
- This immediate decision-making capability ensures that businesses remain agile and can respond promptly to changing conditions.
Actionable Insights
- Improving Product or Service Performance: By analyzing usage patterns and customer feedback, businesses can enhance their offerings to better meet customer needs.
- Optimizing Supply Chains: Predictive analytics can forecast demand fluctuations, enabling businesses to optimize inventory levels and reduce waste.
- Proactively Addressing Maintenance Issues: By monitoring equipment performance in real time, businesses can identify potential failures early and schedule maintenance before a breakdown occurs, reducing downtime and repair costs.
By leveraging advanced data analytics, businesses can unlock the full potential of their IoT solutions, transforming raw data into a strategic asset that enables real-time decision-making, boosts operational efficiency, and elevates customer experience.
Why Data Visualization Is Essential for Scaling IoT in 2025
Data visualization tools, such as interactive dashboards and real-time graphs, enable businesses to see their IoT data in a more digestible and actionable format. These tools help transform complex datasets into clear visual representations, making it easier for decision-makers to identify trends, outliers, and key performance indicators (KPIs) at a glance.
Simplifying Complex Data
- Heat maps (color-based charts that show patterns quickly) can be used to show temperature variations across a factory floor.
- Line charts (simple graphs that show changes over time) can display trends in sensor data over time.
- Geospatial mapping (location-based data shown on maps) can visualize data from GPS-enabled devices in real-time.
Real-Time Visualization
Real-time data visualization is especially important in IoT solutions, as it allows businesses to track performance in real time. For instance, a fleet management system can show a live map of all vehicles, helping fleet managers identify delays and take corrective actions immediately. AI-powered data dashboards can enhance these data visualizations by automatically detecting anomalies and providing actionable recommendations.
Top Business Benefits of Combining IoT Data Analytics and Data Visualization
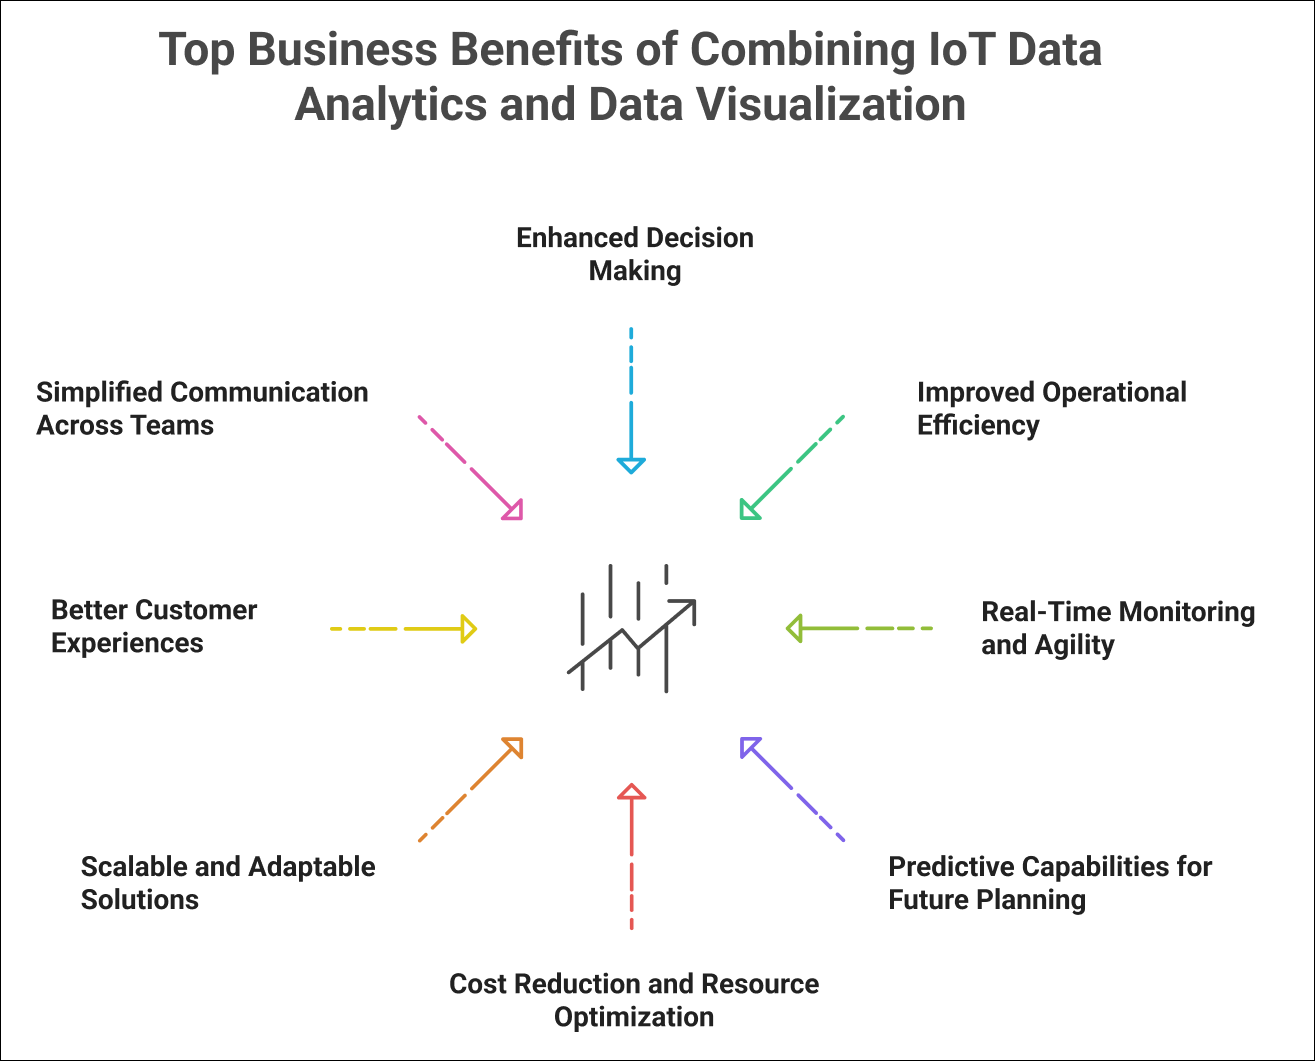
1. Enhanced Decision-Making
- Example: A smart manufacturing system can use visual dashboards to display real-time production data, allowing managers to make quick decisions that optimize production efficiency.
2. Improved Operational Efficiency
- Example: In logistics, real-time data visualization can show the current status of all shipments, allowing businesses to identify and address delays before they escalate.
3. Real-Time Monitoring and Agility
- Example: A fleet management system can visualize real-time data on vehicle performance and routes, enabling businesses to reroute vehicles or schedule maintenance instantly if a problem arises.
4. Predictive Capabilities for Future Planning
- Example: Predicting machinery breakdowns through data analytics and visualizing this data with alerts can help businesses plan maintenance before a failure occurs, reducing unplanned downtime.
5. Cost Reduction and Resource Optimization
- Example: In energy management, data analytics can identify patterns of excessive energy consumption, while visualization tools can present that data in an accessible format, enabling businesses to implement energy-saving measures more effectively.
6. Scalable and Adaptable Solutions
- Example: As a business expands its network of IoT solutions, data visualization tools can be adapted to display new data streams, while data analytics can adjust to accommodate more complex and diverse data sets, ensuring that the IoT solution continues to meet evolving business needs.
7. Better Customer Experiences
- Example: A smart home system can analyze usage patterns and personalize settings for users, while data visualizations show how frequently each device is used, leading to more accurate recommendations and a better overall user experience.
8. Simplified Communication Across Teams
- Example: A visual dashboard showcasing inventory levels, production data, and shipment statuses enables marketing, operations, and logistics teams to work together in real time, ensuring better alignment across the business.
How SculptSoft Powers Your IoT Solutions with Data Analytics and Data Visualization Expertise
1. Tailored Data Analytics for Smarter Decisions
2. Real-Time Data Visualization for Instant Insights
3. Seamless Integration with Leading Cloud IoT Platforms
4. Real-World Use Cases and Industry Expertise
Trust SculptSoft to be your partner in driving smarter decisions and long-term growth.
Conclusion
The growing complexity of real-time IoT data presents a significant challenge for businesses looking to make informed, timely decisions. However, by leveraging advanced IoT analytics platforms and interactive data visualization tools, organizations can transform vast, fragmented datasets into valuable insights. These technologies help break down data silos in IoT ecosystems, improve predictive decision-making, and drive operational efficiency in connected environments, ultimately enabling businesses to capitalize on data-driven IoT opportunities.
By leveraging advanced IoT solutions, big data analytics, and predictive analytics, businesses can unlock the power of real-time insights to streamline operations, forecast trends, and improve customer experiences. SculptSoft specializes in transforming complex IoT data into actionable business intelligence, offering customized IoT solutions that enable companies to scale efficiently and maintain a competitive edge.
Partnering with SculptSoft allows your organization to harness the power of IoT data and drive smarter decisions that promote long-term growth and innovation. We help you turn your data into a strategic asset, enabling your business to achieve greater efficiency and maintain a competitive edge in today’s evolving landscape.
Get in touch with us to transform your IoT data through data analytics and data visualization, turning it into a competitive advantage that drives smarter decisions for growth and innovation.
Frequently Asked Questions
What is IoT, and how does it impact businesses?
The Internet of Things (IoT) refers to the network of physical devices embedded with sensors and software that allow them to connect and exchange data. For businesses, IoT provides real-time insights into operations, helping improve decision-making, optimize processes, and enhance customer experiences.
How do data analytics and visualization improve IoT solutions?
Data analytics and data visualization turn raw IoT data into actionable insights. By processing vast datasets and presenting them visually, businesses can make informed, timely decisions, improve operational efficiency, and enhance overall business performance.
What are the key benefits of combining IoT data analytics and visualization?
Combining IoT data analytics with visualization tools provides businesses with clearer insights, faster decision-making, enhanced operational efficiency, and predictive capabilities. It helps organizations optimize processes, reduce costs, and improve customer experiences with real-time data.
How can businesses scale their IoT solutions effectively?
To scale IoT solutions effectively, businesses need robust data analytics and visualization tools that can handle increasing data volumes and complexity. Scalable solutions help organizations integrate, process, and visualize data as they expand their IoT networks, ensuring efficiency and sustainability.
How can SculptSoft help businesses with IoT data analytics and visualization?
SculptSoft specializes in providing tailored data analytics and visualization solutions for businesses leveraging IoT. From real-time dashboards to predictive analytics, we help businesses optimize operations, reduce costs, and make data-driven decisions that support long-term growth.