PharmaSight Analytics Platform
Overview
PharmaSight Analytics Platform is a centralized analytics solution built for a multi-branch pharmacy business that relied on separate Excel reports to track sales, prescriptions, insurance payments, and medication activity. As data came from different pharmacies and systems, maintaining consistent and reliable reporting became increasingly difficult.
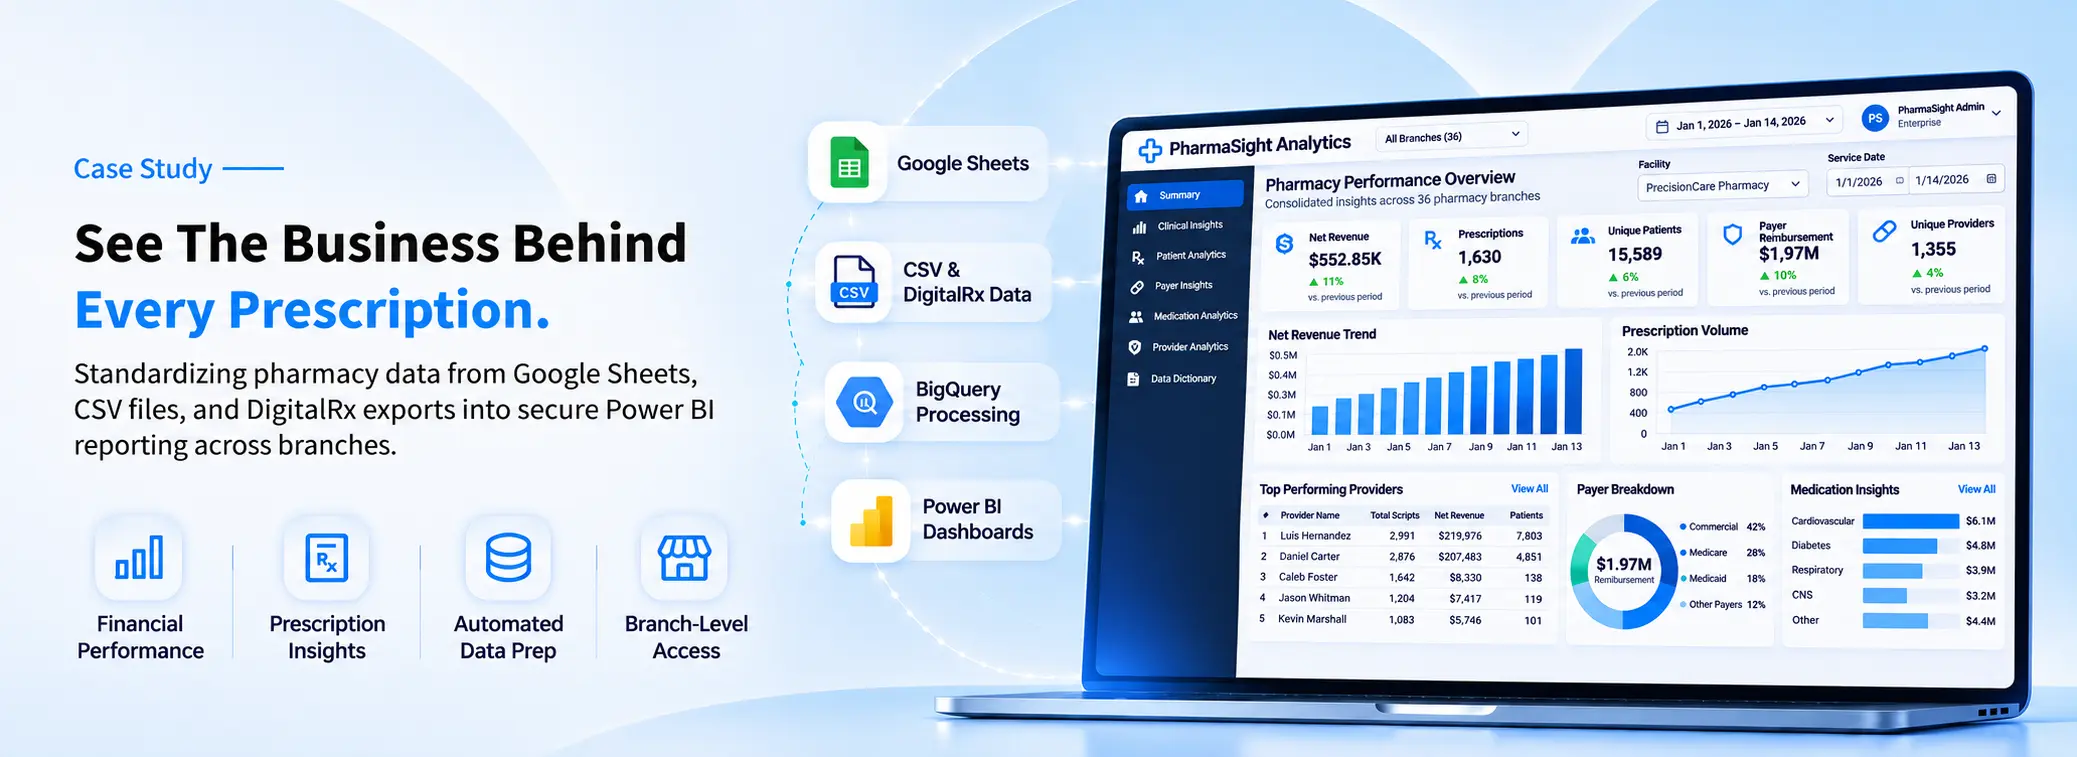
The organization needed an automated reporting environment that could combine data from Google Sheets, CSV files, and pharmacy-system exports. Built primarily on Google Cloud Platform, the solution uses BigQuery to standardize and process pharmacy data and Power BI to provide secure dashboards for financial, prescription, patient, payer, medication, and provider analysis.
Problem Statement
Fragmented pharmacy data:
Important information came from different spreadsheets, files, and pharmacy systems.
Inconsistent source formats:
Different pharmacies supplied data in different structures and formats.
Manual data preparation:
Reporting required repeated effort to clean, organize, and prepare data before analysis.
Inconsistent business metrics:
Differences in source data made it harder to maintain common reporting logic across locations.
Secure access requirements:
Pharmacy users needed relevant reporting access without unnecessarily exposing data from other locations.
Our Solution: Centralized Pharmacy Analytics on Google Cloud
Multi-Source Pharmacy Data Ingestion
The analytics pipeline supports data from Google Sheets, CSV files stored in Google Cloud Storage, and pharmacy-system exports such as DigitalRx. Because the exact source varies by pharmacy, the solution provides a common processing layer for different input formats.
Automated Data Preparation
Scheduled SQL queries and ETL processes clean, transform, and standardize incoming pharmacy data inside BigQuery, reducing the need to repeatedly prepare reporting datasets manually.
Centralized Pharmacy Data Model
Processed information is organized in BigQuery using consistent reporting logic, allowing financial, prescription, patient, payer, medication, and provider metrics to be analyzed from a common data foundation.
Interactive Power BI Reporting
Power BI dashboards turn the standardized datasets into interactive pharmacy analytics, allowing users to review performance across facilities and drill into financial, prescription, payer, patient, medication, and provider activity.
Key Features and Capabilities Delivered
Pharmacy Performance Overview
Brings key business indicators such as patient count, prescription volume, net revenue, payer reimbursement, acquisition cost, and controlled medication activity into one view for faster performance review.
Financial and Payer Analysis
Helps teams examine reimbursement, patient responsibility, acquisition cost, profit, and margin across facilities and payers to better understand what is influencing financial performance.
Prescription and Medication Insights
Provides visibility into prescription volumes, controlled medications, scheduled drugs, opioid quantities, and medication-level activity so teams can review prescribing and dispensing patterns more closely.
Patient and Provider Views
Allows users to explore pharmacy activity from both patient and provider perspectives, helping teams investigate usage patterns, prescription activity, and other factors behind overall performance.
Secure Branch-Level Access
Restricts pharmacy users to the data relevant to their assigned location, while authorized management users can review broader performance across multiple branches.
Interactive Filters and Drill-Down Analysis
Users can move from high-level KPIs into more detailed views using filters such as facility, service date, payer, medication, patient, and provider, reducing the need to work through separate reports.
Outcome and business impact
| Business metric | Result | What made the difference |
|---|---|---|
| Data preparation | Reduced manual reporting effort by 30% | Scheduled SQL queries and ETL processes automate recurring data preparation |
| Multi-source reporting | Centralized | Google Sheets, CSV files, GCS data, and pharmacy-system exports feed a common analytics environment |
| Reporting consistency | Improved by 30 – 40 % | Source data is standardized and transformed in BigQuery before reaching dashboards |
| Pharmacy performance visibility | Broader and easier to analyze | Power BI combines financial, prescription, payer, patient, medication, and provider views |
| Reporting scalability | Stronger foundation for growth | Different pharmacy sources and file formats can be processed through the centralized data architecture |
Business metric
Data preparation
Result
Reduced manual reporting effort by 30%
What made the difference
Scheduled SQL queries and ETL processes automate recurring data preparation
Business metric
Multi-source reporting
Result
Centralized
What made the difference
Google Sheets, CSV files, GCS data, and pharmacy-system exports feed a common analytics environment
Business metric
Reporting consistency
Result
Improved by 30 – 40 %
What made the difference
Source data is standardized and transformed in BigQuery before reaching dashboards
Business metric
Pharmacy performance visibility
Result
Broader and easier to analyze
What made the difference
Power BI combines financial, prescription, payer, patient, medication, and provider views
Business metric
Reporting scalability
Result
Stronger foundation for growth
What made the difference
Different pharmacy sources and file formats can be processed through the centralized data architecture
Technology stack
Potential Use Cases Across Industries
Multi-Location Healthcare Businesses
Healthcare groups can use a similar model to consolidate financial and operational reporting across locations while keeping access controlled at the facility level.
Retail & Distribution Networks
Retailers, distributors, and other branch-based businesses can move historical reporting into a dedicated analytics environment and compare sales, margins, inventory, and location performance more efficiently.
Organizations with Fragmented Data Sources
Businesses receiving operational data through spreadsheets, CSV files, cloud storage, and external systems can use a similar analytics approach to standardize information before reporting.
Still combining pharmacy reports manually from spreadsheets, files, and different systems?
As an AWS Select Tier Services Partner, SculptSoft builds data analytics solutions that bring fragmented operational data into structured cloud environments, automate reporting workflows, and give teams clearer visibility through interactive business intelligence dashboards.
Book a Free 30-Minute Consultation