Healthcare Product Adoption Analytics Platform
Overview
Healthcare Product Adoption Analytics Platform is a centralized analytics solution built for a US-based HealthTech company operating a clinical documentation platform. While the platform generated extensive customer and product activity data, management lacked a clear view of client engagement, feature adoption, integration usage, and platform activity across customers.
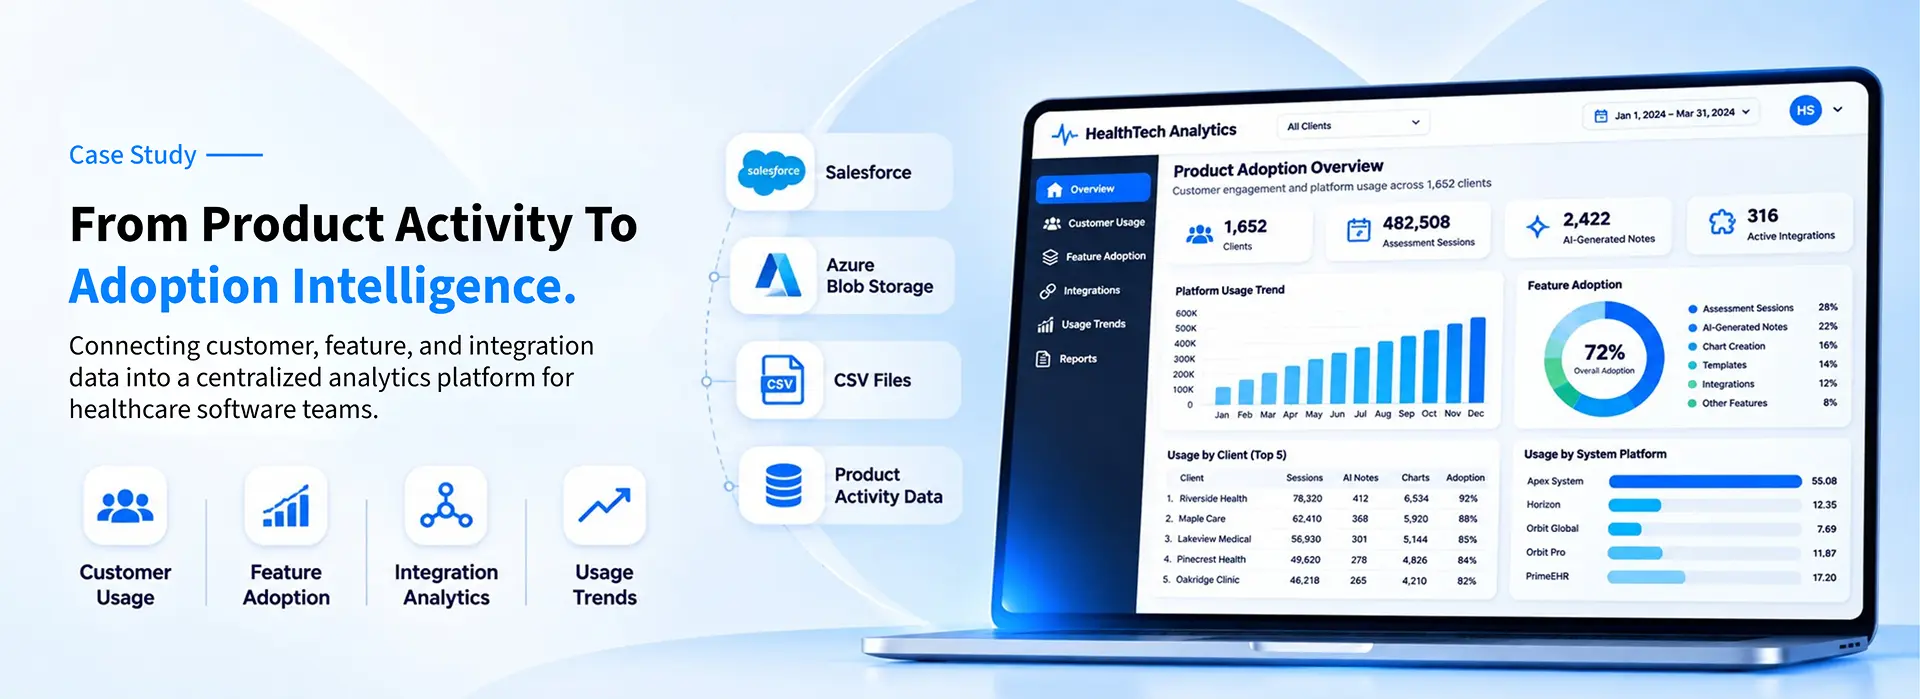
The organization needed consistent product usage reporting that could combine customer and activity data from Salesforce, Azure Blob Storage, and CSV files. Built using Stitch, Python, MySQL, and Tableau, the solution transforms fragmented data into structured analytics and interactive dashboards for tracking customer usage, feature adoption, integration activity, and usage trends.
Problem Statement
Bringing information together from disconnected platforms requires a structured approach to data integration for business analytics, ensuring that information from different sources can be consistently processed, combined, and used for reporting.
Fragmented usage data:
Customer, clinical workflow, and product-activity data were distributed across multiple systems and files.
Limited feature-adoption visibility:
Teams could not easily see how clients were using assessment sessions, AI-generated notes, charts, templates, and integrations.
Difficult customer comparison:
Comparing product usage across clients, locations, and connected systems required data from multiple sources.
Hidden usage trends:
Weekly and monthly changes in platform activity and feature engagement were difficult to identify from raw data.
Slower product decisions:
Without centralized healthcare product analytics, management lacked a clear view of customer engagement and feature adoption.
Our Solution: Centralized Healthcare Product Analytics
Data Consolidation Across Multiple Sources
Salesforce customer data was replicated into a centralized MySQL analytics database using Stitch. Call recordings and related CSV files stored in Azure Blob Storage were also brought into the reporting workflow, allowing information from different parts of the platform to be analyzed together.
Data Processing and Business Logic
Python ETL scripts cleaned, transformed, and combined data from MySQL and Azure Blob Storage. Business rules were applied to create structured, business-friendly datasets for customer activity, feature usage, chart metrics, and other reporting needs. Building reliable analytics workflows also depends on effective data pipeline design and engineering, where data processing, transformation, and integration work together to prepare information for consistent reporting and analysis.
Analytics-Ready Reporting Layer
Processed data was organized into MySQL reporting tables and views before being connected to Tableau. This created a consistent reporting layer and reduced the need to build dashboard logic directly on top of raw source data.
Product Usage and Adoption Reporting
Tableau dashboards give management visibility into customer activity, assessment sessions, AI-generated notes, chart usage, templates, integrations, and broader platform engagement. Users can review trends across clients, system platforms, implementation stages, and time periods from the same analytics environment.
Key Features and Capabilities Delivered
A clearer way to see how customers use the platform, which features they adopt, and where engagement is changing.
Customer Usage Overview
Gives product and business teams a consolidated view of client activity, assessment sessions, and overall platform usage, making it easier to understand how actively customers are engaging with the product.
Feature Adoption Tracking
Shows how customers are using capabilities such as AI-generated notes, chart creation, templates, and other product features, helping teams identify which areas are seeing stronger adoption.
Integration Adoption Visibility
Tracks which clients and work locations are using connected integrations, giving management a clearer view of how integration usage varies across the customer base.
Cross-Client and Platform Analysis
Allows teams to compare usage across clients, locations, and system platforms instead of reviewing each customer in isolation. This helps highlight differences in engagement and product adoption.
Weekly and Monthly Usage Trends
Provides trend views that show how product activity changes over time, helping teams spot increases, declines, or shifts in usage patterns that may need further attention.
Flexible Management Views
Interactive Tableau filters allow users to analyze activity by client, account manager, implementation specialist, implementation stage, system platform, and date, so different teams can focus on the information most relevant to them.
Outcome and business impact
| Business metric | Result | What made the difference |
|---|---|---|
| Customer usage visibility | 1,652 clients represented in the dashboard data | Customer and usage information was brought together into one analytics environment |
| Assessment activity tracking | 482,508 assessment sessions available for analysis | Structured usage datasets made high-volume activity easier to monitor |
| AI feature usage visibility | 2,422 auto-generated notes tracked | Feature-level reporting showed how AI-assisted capabilities were being used |
| Feature and integration adoption | Clearer comparison across clients, locations, and connected platforms | Product activity and integration data could be analyzed through consistent dashboard views |
| Usage trend monitoring | Weekly and monthly engagement patterns became easier to review | Historical usage data was structured for trend-based analysis rather than isolated record checks |
Business metric
Customer usage visibility
Result
1,652 clients represented in the dashboard data
What made the difference
Customer and usage information was brought together into one analytics environment
Business metric
Assessment activity tracking
Result
482,508 assessment sessions available for analysis
What made the difference
Structured usage datasets made high-volume activity easier to monitor
Business metric
AI feature usage visibility
Result
2,422 auto-generated notes tracked
What made the difference
Feature-level reporting showed how AI-assisted capabilities were being used
Business metric
Feature and integration adoption
Result
Clearer comparison across clients, locations, and connected platforms
What made the difference
Product activity and integration data could be analyzed through consistent dashboard views
Business metric
Usage trend monitoring
Result
Weekly and monthly engagement patterns became easier to review
What made the difference
Historical usage data was structured for trend-based analysis rather than isolated record checks
The result is a stronger product analytics foundation that helps business and product teams understand customer behavior, monitor adoption, and identify where engagement is increasing, declining, or needs closer attention.
Technology stack
Potential Use Cases Across Industries
SaaS & Product Companies
Software companies can use a similar approach to track feature usage, customer engagement, adoption trends, and account-level activity across different user groups or product modules.
Healthcare Platforms
Healthcare technology companies can bring together CRM, workflow, integration, and product usage data to understand how customers engage with digital tools and where adoption may need more attention.
Enterprise Software Providers
Companies with multiple clients, locations, or connected systems can use centralized product analytics to compare usage across accounts, monitor integration adoption, and identify differences in platform engagement.
Still relying on scattered product data to understand what customers are actually using?
As an AWS Select Tier Services Partner, SculptSoft builds product analytics solutions that bring CRM, usage, integration, and activity data together so product and business teams can track feature adoption, customer engagement, and platform trends more clearly.
Book a Free 30-Minute Consultation
