Introduction
This blog breaks down how AI-powered data visualization works, why traditional approaches fall short, and the transformative benefits it brings to modern businesses. You’ll also explore industry-specific use cases and discover how SculptSoft helps turn raw data into clear, actionable insights through data visualization services.
What is AI-Powered Data Visualization?
Popular AI-powered data visualization tools like Microsoft Power BI, Tableau, and Google Looker Studio are widely used by businesses to uncover trends, automate insights, and visualize complex datasets in real time. These platforms combine AI with intuitive dashboards to deliver predictive analytics, anomaly detection, and smart recommendations helping organizations turn raw data into actionable business intelligence.
Why Traditional Data Visualization Falls Short
Limitations of Traditional Data Visualization
- Manual Data Preparation
Traditional dashboards often rely on data analysts to clean, format, and input data manually, slowing down the entire process.
- Limited Interactivity
Static charts can’t adjust to changing questions or explore “what if” scenarios dynamically.
- Data Silos
Many tools don’t integrate well with all systems (CRM, ERP, marketing platforms), leaving insights incomplete or fragmented.
- No Predictive Capability
Traditional tools explain the past but fail to forecast future outcomes or identify early warning signs.
- Steep Learning Curve
Non-technical users often struggle to navigate legacy platforms, making them reliant on data experts.
That’s where AI data visualization tools change the game. They eliminate bottlenecks, work across departments, and respond in real time pushing your business from reactive to intelligent and adaptive.
How AI-Powered Data Visualization Transforms Complex Business Data
Here’s How AI Simplifies and Enhances Business Data
-
Manual Data Preparation
Traditional dashboards often rely on data analysts to clean, format, and input data manually, slowing down the entire process. This not only delays insights but also increases the chances of human error and inconsistency.
-
Limited Interactivity
Static charts can’t adjust to changing questions or explore “what if” scenarios dynamically. Users are unable to dive deeper into insights or experiment with different perspectives in real-time.
-
Data Silos
Many tools don’t integrate well with essential systems like CRM, ERP, or marketing platforms. This leads to fragmented or incomplete insights, preventing a holistic view of business performance.
-
No Predictive Capability
Traditional tools explain what happened in the past but lack predictive power. They can’t forecast outcomes, spot trends, or issue early warnings that are critical for proactive decisions.
-
Steep Learning Curve
Non-technical users often struggle with legacy platforms due to their complexity. This dependency on data specialists slows down access to information and limits widespread data use.
Benefits of AI-Powered Data Visualization for Businesses
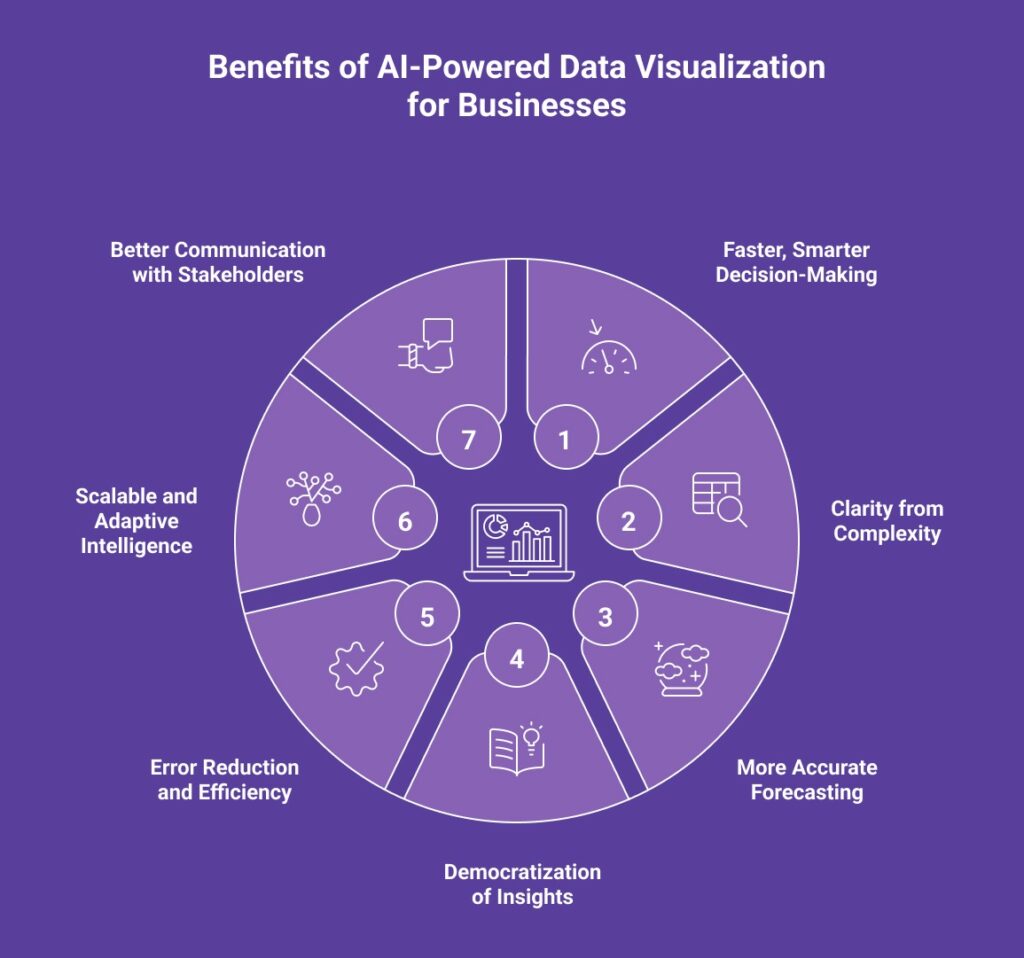
- Faster, Smarter Decision-Making
With real-time AI dashboards, business leaders no longer need to wait days for reports. They can monitor KPIs, uncover anomalies, and act instantly. Whether adjusting budgets, reallocating resources, or pivoting strategy, decisions are based on the most up-to-date, relevant insights.
- Clarity from Complexity
AI simplifies complex business data by breaking it down into visual narratives. Instead of sifting through thousands of data rows, users view dynamic graphs, interactive heatmaps, and predictive timelines, making it easier to spot patterns, trends, and opportunities.
- More Accurate Forecasting
Predictive analytics with AI helps businesses move from reactive to proactive. By analyzing historical data and market behavior, AI tools forecast demand, customer churn, or a decrease in revenue, giving professionals time to prepare or pivot.
- Democratization of Insights
AI-powered dashboards don’t just serve analysts. With natural language queries and intuitive interfaces, anyone from HR to logistics can explore data and generate their own insights. This fosters a data-driven culture across all departments.
- Error Reduction and Efficiency
Manual data analysis is prone to oversight. AI eliminates human error in data cleaning, interpretation, and visualization boosting both accuracy and efficiency. Teams can spend less time preparing data and more time using it.
- Scalable and Adaptive Intelligence
As your business grows, so does your data. AI scales effortlessly with large and diverse datasets while adapting visual outputs to fit changing needs without rebuilding reports from scratch.
- Better Communication with Stakeholders
Data visualizations enhanced with AI storytelling tools present findings in compelling ways that stakeholders can understand instantly bridging the gap between technical analysis and business strategy.
Use Cases of AI-Powered Data Visualization Across Industries
- Retail & Ecommerce
In the retail and ecommerce sector, AI-powered data visualization tools play a vital role in enhancing the customer experience and optimizing business operations. These tools help map the entire customer journey from initial website interactions to final purchase behavior, identifying drop-off points and friction zones that can be addressed to improve user experience, boost conversions, and reduce cart abandonment.
Retail giants like Walmart leverage AI-driven dashboards to monitor real-time sales, forecast demand based on seasonal and historical trends, and optimize inventory levels minimizing overstock and avoiding stockouts for a more resilient supply chain. Additionally, by integrating data from web analytics, CRM systems, and social media platforms, these intelligent dashboards provide granular insights into customer segments, allowing for hyper-personalized marketing campaigns that significantly increase engagement and return on investment.
- Finance & Banking
In the finance and banking sector, AI-powered data visualization tools are revolutionizing how financial institutions manage risk, detect fraud, and make informed decisions. These tools can instantly identify anomalies in spending behavior, helping banks and financial firms flag suspicious activity and perform rapid compliance checks through interactive dashboards.
Investment firms leverage AI dashboards to monitor real-time market movements, asset performance, and regulatory changes enabling quicker, more strategic decision-making. Additionally, predictive financial analysis powered by AI visualizations helps data analysts forecast asset trends, assess portfolio risks, and simulate various market scenarios, all of which contribute to smarter investment planning and improved financial outcomes.
- Healthcare
In the healthcare sector, AI-powered data visualization is enhancing patient care, operational efficiency, and public health strategies. Hospitals use live dashboards to monitor patient vitals, lab results, and treatment histories in real time, enabling clinicians to detect complications early and make more informed decisions for better patient outcomes.
At the operational level, AI dashboards assist in optimizing hospital resources, resulting in shorter wait times and improved service quality. Meanwhile, public health agencies use AI tools to visualize health trends across demographics like region, age group, and medical condition supporting proactive disease prevention measures and more targeted health campaigns.
- Manufacturing
In the manufacturing sector, AI-powered data visualization is streamlining operations and enhancing productivity. By integrating data from IoT sensors and ERP systems, AI dashboards provide real-time visibility into production metrics, allowing experts to quickly detect inefficiencies, fine-tune workflows, and ensure consistent product quality.
Predictive maintenance is another major advantage – manufacturers can visualize machine wear patterns and forecast potential failures, minimizing unexpected downtime. Additionally, AI-driven visualization of supply chain data from suppliers, logistics, and inventory systems helps identify bottlenecks, delays, and inefficiencies, leading to smarter, more responsive supply chain management.
- Transportation & Logistics
In the transportation and logistics sector, AI-powered data visualization is driving smarter, more efficient operations. Intelligent dashboards analyze factors like traffic conditions, weather, and delivery timelines to optimize route planning, reducing fuel costs and ensuring quicker deliveries.
At the same time, real-time visualizations of fleet data including vehicle locations, maintenance schedules, fuel consumption, and driver behavior enable logistics companies to enhance operational efficiency, ensure timely maintenance, and minimize safety risks.
Together, these industry-specific applications highlight how AI-powered data visualization is not just a technological upgrade, it’s a strategic asset that helps organizations drive smarter decisions and improve outcomes.
How SculptSoft Helps Businesses with AI-Powered Data Visualization
Our data visualization experts build tailored solutions that integrate with your existing data sources such as CRMs, ERPs, cloud platforms, and third-party APIs ensuring a seamless, real-time data flow. Whether you’re a healthcare provider, retailer, manufacturer, or financial institution, our data visualization services are adapted to your specific use case and KPIs. This ensures your data visualization is not only visually engaging but also business-relevant and goal-oriented.
Final Thoughts - From Raw Data to Smart Decisions
Having large amounts of data is only useful if you can understand and act on it. AI-powered data visualization helps turn raw and complex information into clear insights that support better and faster decisions. Instead of relying on manual reports or static charts, businesses can use smart dashboards to see real-time trends, spot issues early, and plan with confidence.
This approach makes it easier to understand what’s happening across departments, why it’s happening, and what actions to take. From healthcare and finance to retail and manufacturing, AI-powered tools help teams make smarter choices and improve performance at every level.
At SculptSoft, we specialize in building AI-powered data visualization solutions that are tailored to your business needs. Our dashboards connect to your existing systems, clean and organize your data, and present it in interactive formats that are easy to understand and act on.
We help transform your data into a powerful business asset, one that supports real-time decisions and long-term growth.
Frequently Asked Questions
What is AI-powered data visualization and how does it work?
AI-powered data visualization uses artificial intelligence techniques like machine learning and natural language processing to automatically analyze, interpret, and visually present complex business data. It transforms raw data into interactive dashboards, charts, and graphs that reveal patterns, trends, and predictions helping businesses make faster, smarter decisions in real time.
Why are traditional data visualization tools no longer enough?
Traditional tools rely on static charts and manual data prep, which can’t keep up with real-time business needs. They lack predictive capabilities, interactivity, and scalability. AI-powered visualization solves these issues by automating analysis, identifying patterns, and delivering insights instantly across multiple systems.
How does AI improve decision-making through data visualization?
AI enhances decision-making by transforming raw data into real-time, actionable insights. It detects patterns, predicts trends, and allows users to ask questions in plain language. This empowers leaders to act quickly with clear, data-backed strategies, improving agility and performance.
What are the main benefits of AI-powered data visualization for businesses?
Key benefits include real-time insights, improved forecasting, reduced errors, cross-departmental access to data, and faster decisions. Businesses also gain scalability and better communication through intuitive, visually-rich dashboards tailored to their goals.
Which industries use AI-powered data visualization the most?
Industries like healthcare, finance, retail, manufacturing, and logistics widely use AI-driven dashboards. These tools help detect fraud, manage inventory, monitor patients, forecast demand, and optimize supply chains through real-time, intelligent visualizations.
Can AI data visualization tools predict future business trends?
Yes, AI data visualization tools use predictive analytics to forecast trends like customer behavior, sales performance, and operational risks. This helps businesses move from reactive to proactive planning with more accuracy and less guesswork.